3.6 Geometric objects
A geom is the geometrical object that a plot uses to represent data.
For example, bar charts use bar geoms, line charts use line geoms, boxplots use boxplot geoms, and so on. Scatterplots break the trend; they use the point geom.
To change the geom in your plot, change the geom function that you add to
ggplot().
以下例子使用相同的data set但不同的geom函數作圖:
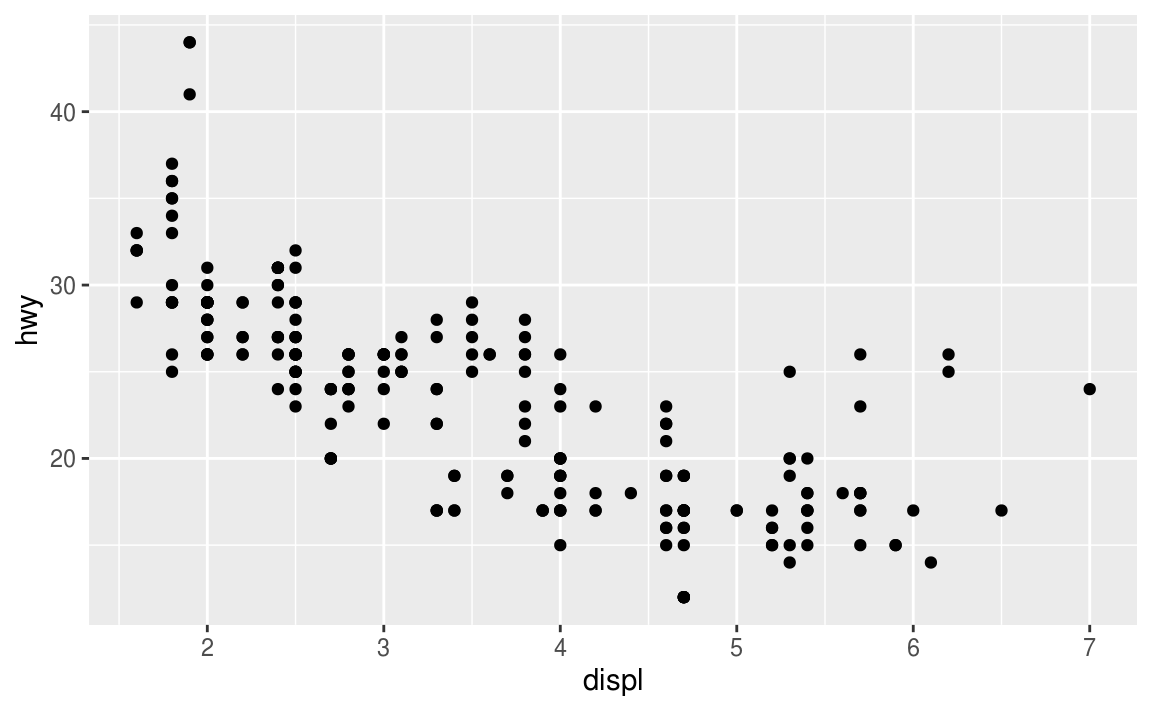
ggplot(data = mpg) +
  geom_point(mapping = aes(x = displ, y = hwy))
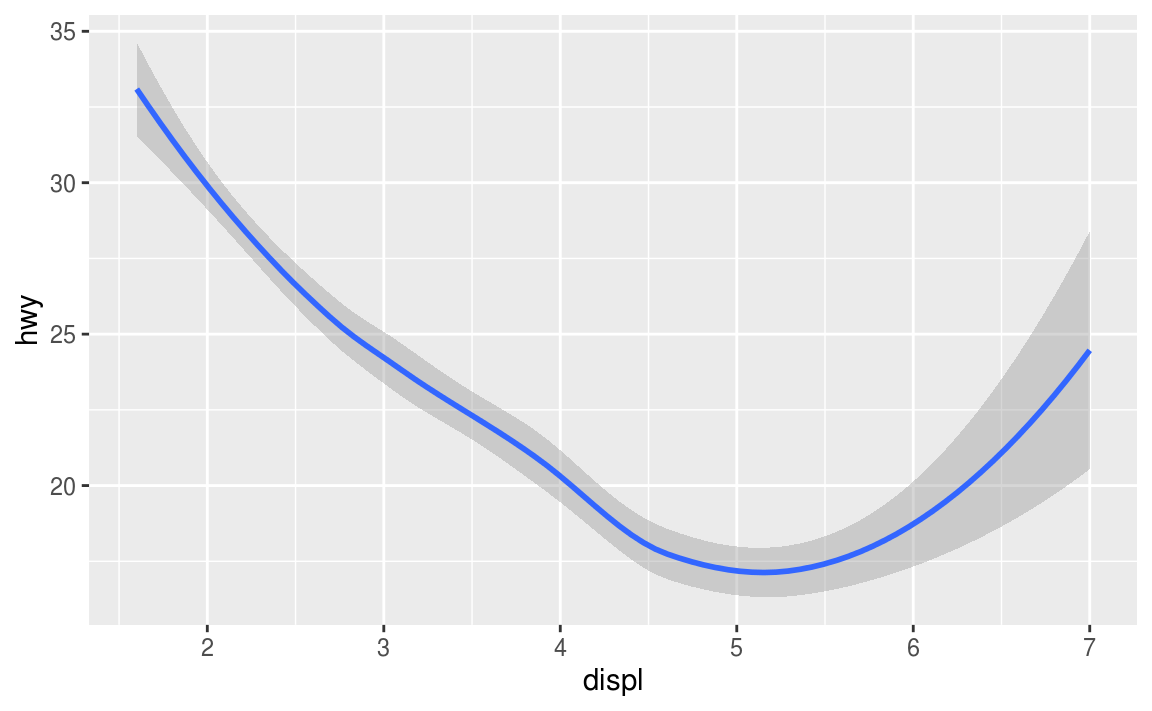
ggplot(data = mpg) +
  geom_smooth(mapping = aes(x = displ, y = hwy))
- set the
groupaesthetic to a categorical variable to draw multiple objects
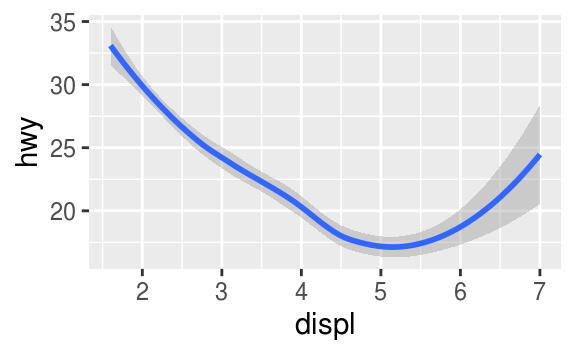
#尚未群組化之原始code
#ggplot(data = mpg) +
# geom_smooth(mapping = aes(x = displ, y = hwy))
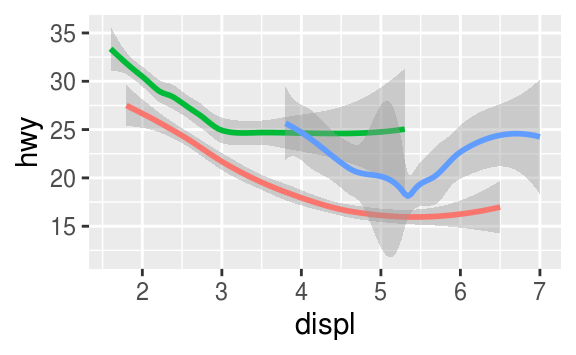
#set the group aesthetic to a categorical variable, drv
ggplot(data = mpg) +
geom_smooth(mapping = aes(x = displ, y = hwy, group = drv))

#set different color under different level of drv
ggplot(data = mpg) +
  geom_smooth(
    mapping = aes(x = displ, y = hwy, color = drv),
    show.legend = FALSE
  )
- display multiple geoms in the same plot, add multiple geom functions to
ggplot():
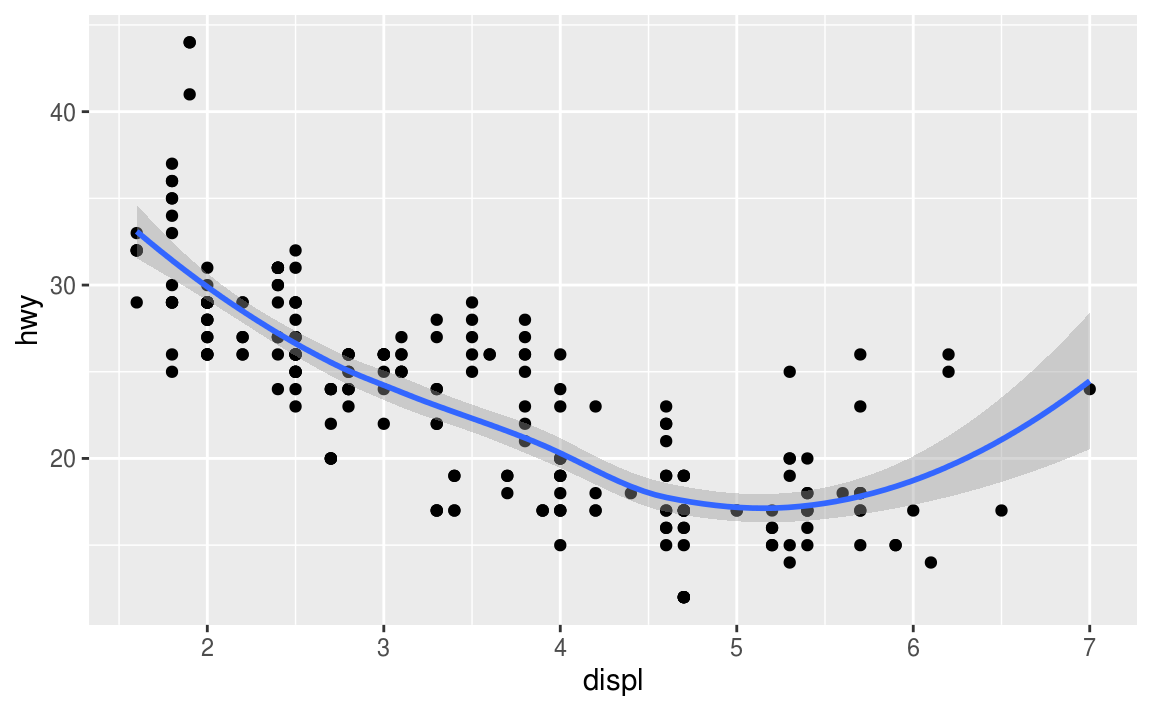
# display multiple geoms in the same plot
ggplot(data = mpg) +
  geom_point(mapping = aes(x = displ, y = hwy)) +
  geom_smooth(mapping = aes(x = displ, y = hwy))

#等價如下列code
#ggplot(data = mpg, mapping = aes(x = displ, y = hwy)) +
#  geom_point() +
#  geom_smooth()
# Passing a set of mappings to ggplot().
# ggplot2 will treat these mappings as global mappings
# that apply to each geom in the graph. ---
# If you place mappings in a geom function, ggplot2 will treat them as local mappings for the layer.
# It will use these mappings to extend or overwrite the global mappings for that layer only.
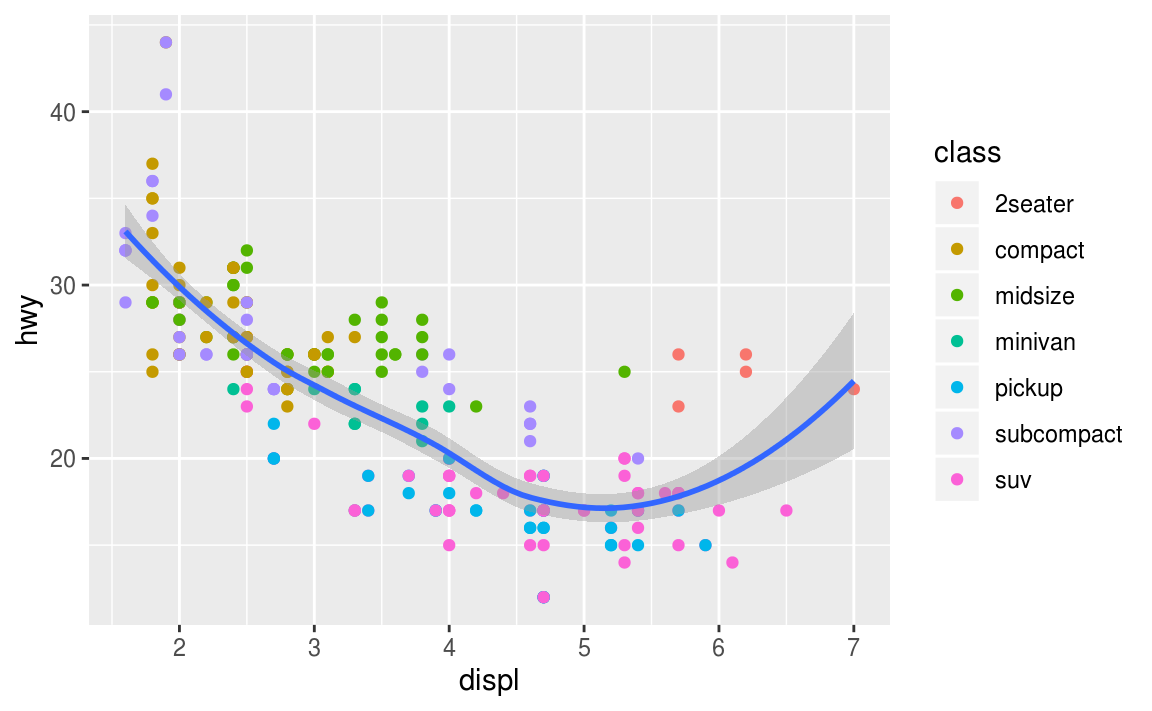
ggplot(data = mpg, mapping = aes(x = displ, y = hwy)) +
geom_point(mapping = aes(color = class)) + #The local data argument in geom_smooth() overrides the
geom_smooth() #global data argument in ggplot() for that layer only.---
#與上述比較argument passing
#ggplot(data = mpg, mapping = aes(x = displ, y = hwy, color = class)) +
# geom_point() +
# geom_smooth()
Exercise 3.6.6
Recreate the R code necessary to generate the following graphs.
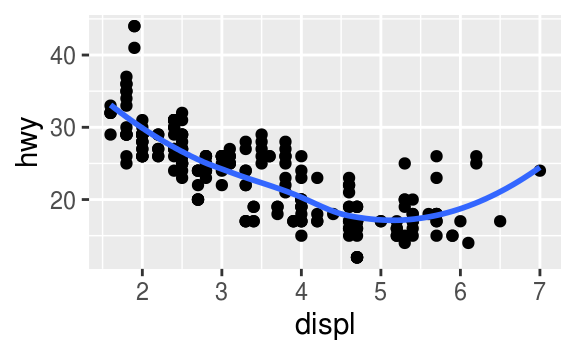
ggplot(data = mpg, mapping = aes(x = displ, y = hwy)) +
  geom_point() +
  geom_smooth(se = FALSE) #不顯示平滑曲線的標準誤
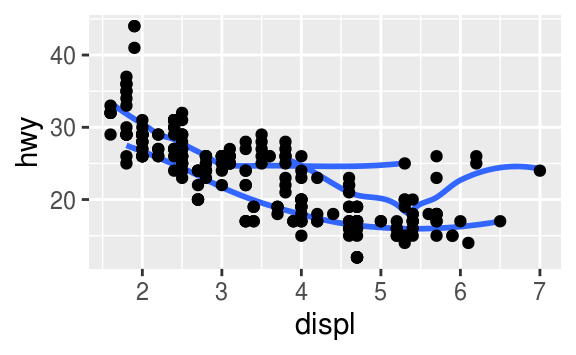
> ggplot(data = mpg, mapping = aes(x = displ, y = hwy)) +
+   geom_point() +
+   geom_smooth(se = FALSE, mapping = aes(group = drv))
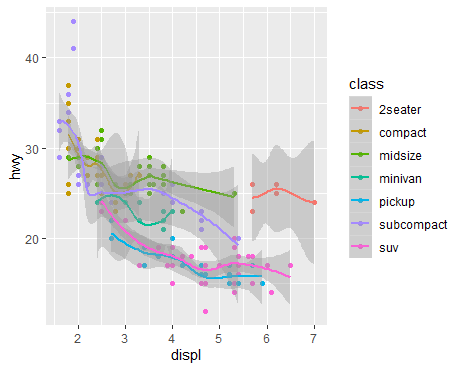
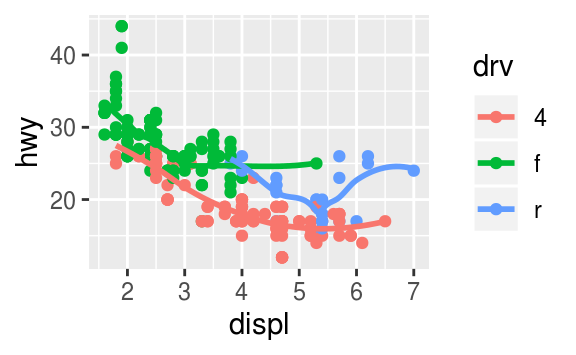
ggplot(data = mpg, mapping = aes(x = displ, y = hwy, color = drv)) +
  geom_point() +
  geom_smooth(se = FALSE)
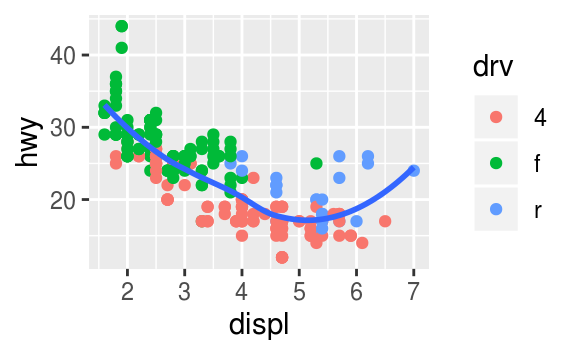
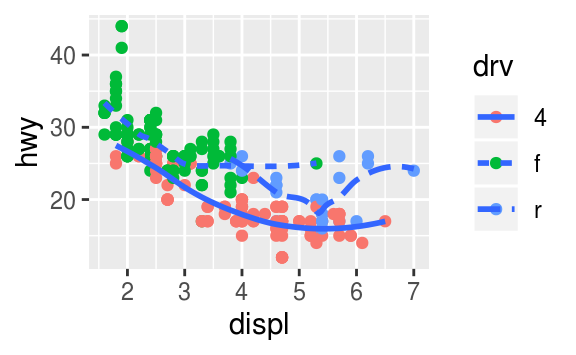
ggplot(data = mpg, mapping = aes(x = displ, y = hwy)) +
  geom_point(mapping= aes(color = drv)) +
  geom_smooth(se = FALSE,mapping= aes(linetype = drv))
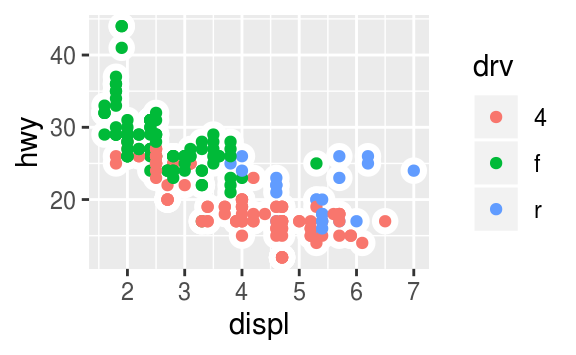
ggplot(data = mpg, mapping = aes(x = displ, y = hwy)) +
  geom_point(size= 4, color = "white") +
  geom_point(mapping =aes(color = drv) )
